


Evaluating Aluminum Bonds
Adhesively joined aluminum alloy sheets present challenges that steel-adhesive joints do not. Ford researchers present a modified technique to inspect Al-adhesive joints in lab and production environments.

Adhesive bonding technology has gained ever-increasing significance in the automotive industry, especially with the growing use of aluminum (Al) alloy body structures. The variability in thicknesses of the metal and adhesive layers, as well as in joint geometry, of automotive components has presented challenges in nondestructive evaluation of adhesive joints.
Though these challenges were recently overcome for steel-adhesive joints using an ultrasonic pulse-echo technique, the difference in acoustic impedances of steel and Al leads to a lack of robustness in utilizing the same algorithm for Al-adhesive joints. Researchers from Ford Motor Co. and the Institute for Diagnostic Imaging Research employed a modified version of this technique to inspect Al-adhesive joints in both laboratory and production environments.
A 15-MHz, 52-pixel, 10- x 10-mm (0.4- x 0.4-in) matrix array of ultrasonic transducers was used to obtain ultrasonic pulse echoes from joint interfaces, analysis of which produced C-scan images of the adhesive bead. The instrument and technique were extensively tested in an automotive plant on the hem adhesive around an Al hood, a very challenging joint geometry. The adhesive bead width obtained ultrasonically matched the width measured after teardown within 1 mm (0.04 in) with an accuracy of 94%.
Need for nondestructive evaluation
Structural epoxy adhesives provide several key benefits to vehicles, improving the NVH characteristics of the ride, as well as the corrosion performance. In body components, adhesives are applied along the flange length prior to part mating and subsequent spot joining, using resistance spot welds or self-piercing rivets. The continuous adhesive bead, once cured, serves to join the flange over a much wider area than spot joints alone and enhances flange stiffness.
In closure applications, adhesives are applied around the part perimeter prior to hemming, to similarly increase component stiffness. Once the adhesive is cured, load is transferred along the flange length more efficiently than by merely folding the closure outer panel around the inner panel. Also, the adhesive in closure hems prevents ingress of liquids between the panels, providing corrosion resistance.
These desired vehicle characteristics can only be realized if optimum adhesive coverage has been achieved, meaning the adhesive has wetted both joint surfaces over a sufficiently wide bead and in the specified locations. Once the parts are mated, and spot joined or hemmed, monitoring the adhesive coverage requires teardown. This adds significant cost to the manufacturing process, especially for Al alloy components.
Several variables influence adhesive coverage, including part fit-up, whether the spot joints have led to sheet pillowing (increasing the gap between the sheets), variability in the dispensed bead location, adhesive dispense temperature, and stand-off distance of the adhesive gun from the part surface, not to mention clogged dispense nozzles and air bubbles in the dispense equipment lines. Too often excessive amounts of adhesive are used to ensure full coverage despite possible compounding manufacturing variables, leading to squeeze-out of adhesive from between the sheets.
Therefore, a nondestructive technique to validate adhesive dispense parameters would be valuable in setting up the multitude of adhesive dispense lines in plants, as well as on prototype components, which are not available for teardown. An even more significant impact would be to replace the scheduled adhesive teardown during production, ensuring component quality without the substantial cost of destroying parts.
Automotive adhesive joints
Automotive vehicles can include adhesive bonds between metal sheets with a large range of thicknesses, from 0.7 to 3 mm (0.028 to 0.12 in). More significantly, the sheets might be stamped and drawn before being bonded, leading to final sheet thicknesses that differ from the nominal values by non-negligible amounts. In addition, thickness of the adhesive layer may vary within 0.1 to 1 mm (0.004 to 0.04 in), due to fit-up variations and pillowing of the sheet metal caused by spot joining. Typical widths of adhesive beads in automotive applications are 10 to 15 mm (0.4 to 0.6 in), corresponding to minimum bead widths of 7 to 10 mm (0.28 to 0.4 in). It is therefore desired to be able to read the adhesive bead width with a spatial resolution of 1 mm or better.
The above variabilities and requirements have proved very challenging to a large number of ultrasonic nondestructive techniques. These approaches have been discussed and analyzed in the researchers’ previous SAE paper (2012-01-0475) on inspection of steel-adhesive joints. The paper also established the technical reasons for choosing the two-dimensional, non-phased, ultrasonic array, pulse-echo technique, and signal-processing algorithm, as well as the fact that the technique can be used in industrial environments to measure the adhesive bead width of steel-adhesive joints within 1 mm with an accuracy of 96%.
The algorithm developed for steel-adhesive joints, as anticipated, proved inadequate for inspecting Al-adhesive joints, due to the different acoustic impedances of steel and Al. It is, however, of great value for plants to utilize the same instrument and technique for all adhesive joints. This strong preference stems from not only cost considerations of purchasing new equipment, but also the time, cost, and complexity of training and certifying operators and techniques.
Steel- vs. Al-adhesive joints

The matrix array of square ultrasonic transducers, from Tessonics Corp., was used in the laboratory experiments and plant trials (Figure 1). The array was coupled to the joints through a delay rod, with sufficient ultrasonic gel at all contact surfaces to ensure optimum transmission of ultrasonic energy. Each array pixel was individually operated in pulse-echo mode to obtain the ultrasonic reflections from the various joint interfaces. Each echotrain was then analyzed to provide an index of merit for adhesive coverage. The indexes from all array pixels were then interpolated and further analyzed to obtain an automatic reading of the compressed adhesive width.

Compared to ultrasonic echoes from an un-adhered interface, the echoes encountering a metal-adhesive interface dissipate more and by approximately the same fraction for each reflection. Therefore, amplitude of the later echoes, which have encountered the metal-adhesive interface a larger number of times, will be smaller than echoes from un-adhered regions by a larger fraction, providing a clearer differentiation than earlier echoes. As a result, the time window for the steel-adhesive joints, shown approximately by the horizontal blue arrow in Figure 2a, had been chosen as late as possible, while avoiding noises that inevitably affect later echoes that are too small.
The exact start time for the optimum window depends nominally on the sheet thickness, to better reduce noise. This late time window serves very well for steel-adhesive joints, providing 96% accuracy in the agreement between the ultrasonic and teardown measurements of the adhesive bead width within 1 mm. However, the different acoustic impedances of steel and Al lead to sufficiently large differences in the reflected echotrain that using the same algorithm for Al leads to substantial errors in the ultrasonic readings.
The engineering specification for adhesive thickness in automotive joints is 0.1-1 mm. Since the joint strength is increasingly improved as the adhesive thickness is decreased over this range, manufacturing processes are more and more optimized toward the lower end of this range. For the thicker adhesive layers in this range, the ultrasonic energy that enters the adhesive (the leftmost red line and arrow in Figure 2b) attenuates a great deal before impinging on the bottom sheet of the joint. However, as the adhesive thickness is reduced, a larger amount of energy is reflected from the bottom sheet and can be detected. Therefore at later times, the echotrain, which almost entirely consisted of echoes from the top sheet, can also include echoes from the bottom sheet (the red lines and arrows in Figure 2b), adding greatly to the complexity of the detected signal at later times.
For steel-adhesive joints, the acoustic impedances of steel and typical epoxy adhesives (~47x106 kg/m2s vs. ~2.7x10⁶ kg/m2s) are very different, leading to the coefficients of reflection at both the steel-adhesive and adhesive-steel interfaces being nearly in unity (~89%). Therefore, the echoes from the top sheet persist for a long time, and only a small amount of the ultrasonic energy enters the adhesive. Thus, regardless of the adhesive thickness, any reflections from the bottom sheet are too small to noticeably affect the amount of energy in later windows.
The acoustic impedance of Al (~17x106 kg/m2s), however, is much closer to that of adhesives, leading to smaller reflection coefficients (~73%) at both interfaces. Therefore, echoes from the top sheet decay at a faster rate, leading to much smaller amplitudes at later times (i.e., in the red oval in Figure 2a) compared to the earlier echoes. Perhaps more significantly, these smaller reflection coefficients lead to a larger amount of the ultrasonic energy entering the adhesive and subsequently reflecting from the bottom sheet and being detected (note the irregular echoes in the red oval in Figure 2a, compared to the much more regular echotrain at the same time for steel).
Since the adhesive thickness is not known and the signal-to-noise ratio is low in the later parts of the echotrain, it is not possible to reliably subtract out these unwanted echoes in the analysis. Therefore, the window used for Al-adhesive joints had to be shifted to earlier times, for which the echoes of interest are more pronounced (approximately shown by the blue arrow in Figure 2a). Since it is difficult to theoretically estimate the effectiveness of this choice, due to the compounding influences of the many unknown parameters applicable to inspections in industrial environments, the capability and robustness of this approach can only be determined experimentally.
Experimental validation
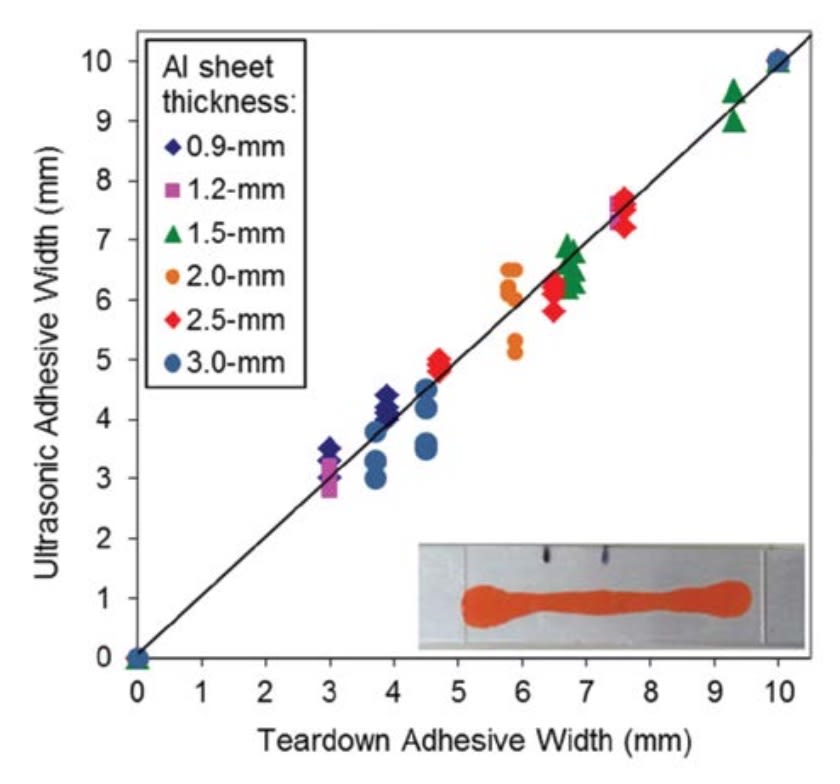
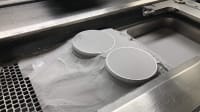
Laboratory adhesive specimens with a range of Al sheet thicknesses — 0.9 to 3 mm — bonded with different thicknesses of a 1-component structural epoxy were utilized to optimize the timing and length of the processing window. The specimens used to optimize measuring the bead width consisted of unpainted Al sheets adhered to a glass pane as the bottom sheet (Figure 3). The very similar acoustic impedances of Al and glass allow the specimens to serve as stand-ins for automotive joints, while also allowing the adhesive width to be readily measured. Glass beads were mixed with the adhesive to control the adhesive thickness (~0.25 mm).
For other specimens no glass beads were used and the adhesive was compressed a great deal to obtain very thin beads, representing the most challenging inspection condition. These latter specimens were torn down, confirming that beads that were too thin (discontinuous coverage of adhesive) were correctly categorized as unacceptable, corresponding to C-scan images for which a clear and robust adhesive bead couldn’t be identified. Figure 3 displays the correlation obtained by two operators, each measuring a set of specimens twice, displaying the algorithm’s capability for the large range of Al sheet thicknesses (R2 = 0.98). Only two different windows were needed to obtain these results for the full range of Al sheet thicknesses. The optimum start and stop times of the processing windows for the various Al sheet thicknesses were minimally different, chosen mostly to not coincide with an echo.
The correlation was obtained for cured adhesive, establishing the capability for use in containment situations in plants. However, the technique was also tested and works equally well for uncured adhesive, i.e., a condition similar to optimizing adhesive dispense lines and scheduled quality inspections. Moreover, the optimum algorithm parameters do not depend on the adhesive type, since the acoustic impedance of all structural adhesives investigated are sufficiently close to be indistinguishable.
Once the technique was confirmed to satisfy the needed repeatability and reproducibility requirements, it was tested in an automotive assembly plant on the hem of an Al hood. The adhesive (a different 1-component epoxy) was left uncured, representing the most common use of this technique, i.e., scheduled inspections during production. The compressed adhesive bead width was measured at 81 predetermined locations around the hood perimeter from the class A surface. The outer Al sheet was nominally 0.85 mm (0.033 in) thick (before hemming). The curved metal sheet at the hem edge represents one of the most challenging joint geometries, since the curvature distorts the incoming and outgoing ultrasound beams. Accordingly, the instrument uses the amplitude of the first ultrasonic echo to check whether the curvature is too severe to obtain trustworthy readings, therefore guiding the operator in better placement of the array. For both ultrasonic and teardown measurements, it can be very difficult to distinguish the adhesive bead width under the class A surface from the adhesive that has been compressed further into the hem bend, i.e., reaching the hem root. As expected, this complicates correlating the ultrasonic and teardown results, and leads to a much larger variation for hem joints, vs. the flat, simple-overlap joints typical of body structures.
The dispensed adhesive volume was deliberately reduced at locations to produce bond widths that were less than the minimum acceptable adhesive width (7 mm) or completely missing. After the ultrasonic measurements, the hem was carefully opened, so that the operator could measure the adhesive width at the same locations using a vernier caliper. Due to the difficulties in measuring the teardown width at the same exact location as the ultrasonic reading, and to obtaining accurate teardown measurements, since the adhesive can smear during teardown, a small fraction of the data points were not included. Based on these factors, a conservative error of ±1 mm was associated with the teardown readings.

Figure 4 displays the overall correlation between the ultrasonic and teardown adhesive width readings for the more than 2000 inspected locations in this plant trial. The best-fit line to the data is y = 0.94x + 0.18 with R2=0.81. The slope of the best-fit line is less than one, because smearing of the adhesive would lead to the teardown readings being systematically larger. If we take the ±1 mm uncertainty in measuring teardown widths into account, the ultrasonic measurements match the teardown readings with an accuracy of 94%, satisfying the inspection requirements in plants readily. Including this ±1 mm uncertainty in calculations of the nondestructive testing error rates: false-call error rate = 2% and miss-call error rate = 4%, which readily pass the usual target error rates of 5% and 20%, respectively. These results firmly establish the capability of this technique for inspection of Al-adhesive joints.
This feature is based on Ghaffari, B., Dekam, J., Haddix, K., Lazarz, K. et al., “Nondestructive Evaluation of Adhesively-Joined Aluminum Alloy Sheets Using an Ultrasonic Array,” SAE Technical Paper 2015-01-0702, 2015, doi:10.4271/2015-01-0702.
More From SAE Media Group
Tech Briefs
Rapidly Printing with Liquid Metal


Power Electronics INSIDER
World’s Strongest Battery Paves Way for Light, Energy-Efficient Vehicles
Automotive Engineering
Assembling Aluminum Vehicles in Volume
Tech Briefs
A New Method to Design Better Metallic Materials
Medical Design Briefs
Achieving High Marks for Medical Device Makers: Ultrashort Pulse Lasers
Tech Briefs
New on the Market

Aerospace INSIDER
A New Platform for Developing Advanced Aerospace Metals at Scale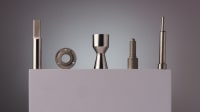
Battery & Electrification Technology
Wire Feed Laser Welding for Battery Pack Aluminum Enclosure Manufacture in EVs
Photonics & Imaging Technology
Deformation Fingerprints Will Help Researchers Identify, Design Better Metallic Materials
Electronics & Sensors INSIDER
An Electronic Fiber for Stretchable Sensing
Automotive Engineering
A Hundred Innovations for Renault’s Eolab Concept
Aerospace & Defense Tech Briefs
Testing Military-Grade Adhesive in Extreme Loading Conditions
Power Electronics INSIDER
An Electrifying Improvement in Copper Conductivity
Power Electronics INSIDER
Highly Conductive Aluminum Can Equal Copper
Tech Briefs
Method 3D-Prints Marine-Grade Stainless Steel
Aerospace Manufacturing and Machining INSIDER
How Airbus is Using w-DED to 3D Print Larger Titanium Airplane Parts

Aerospace & Defense Tech Briefs
Redefining Modern US Navy Shipbuilding with Additive Manufacturing
Aerospace & Defense Tech Briefs
Plasma Electrolytic Oxidation: The Future of Lightweight Designs in Aerospace and Defense
Medical Design Briefs
Consider Phase Zero: The Importance of DFX to Meet Deadlines, Deliverables
Aerospace & Defense Tech Briefs
Finding the Perfect Aluminum for Additive Manufacturing
Aerospace Manufacturing and Machining INSIDER
Riveting Technology Enables Lightweight Magnesium Fasteners for Fuel Efficiency

NASA Spinoff
3D Printed Engines Propel Next Industrial Revolution
Top Stories
INSIDERManufacturing & Prototyping
![]() How Airbus is Using w-DED to 3D Print Larger Titanium Airplane Parts
How Airbus is Using w-DED to 3D Print Larger Titanium Airplane Parts
NewsAutomotive
![]() Microvision Aquires Luminar, Plans Relationship Restoration, Multi-industry Push
Microvision Aquires Luminar, Plans Relationship Restoration, Multi-industry Push
INSIDERAerospace
![]() A Next Generation Helmet System for Navy Pilots
A Next Generation Helmet System for Navy Pilots
INSIDERDesign
![]() New Raytheon and Lockheed Martin Agreements Expand Missile Defense Production
New Raytheon and Lockheed Martin Agreements Expand Missile Defense Production
ArticlesAR/AI
![]() CES 2026: Bosch is Ready to Bring AI to Your (Likely ICE-powered) Vehicle
CES 2026: Bosch is Ready to Bring AI to Your (Likely ICE-powered) Vehicle
Road ReadyDesign
Webcasts
Semiconductors & ICs
![]() Advantages of Smart Power Distribution Unit Design for Automotive...
Advantages of Smart Power Distribution Unit Design for Automotive...
Unmanned Systems
![]() Quiet, Please: NVH Improvement Opportunities in the Early Design...
Quiet, Please: NVH Improvement Opportunities in the Early Design...
Electronics & Computers
![]() Cooling a New Generation of Aerospace and Defense Embedded...
Cooling a New Generation of Aerospace and Defense Embedded...
Power
![]() Battery Abuse Testing: Pushing to Failure
Battery Abuse Testing: Pushing to Failure
AR/AI
![]() A FREE Two-Day Event Dedicated to Connected Mobility
A FREE Two-Day Event Dedicated to Connected Mobility