


Engineered Resilient Systems
A new application called TradeAnalyzer provides multiple visualization methods to examine, sort, and filter the attributes of data.
Analyzing large data is the process of methodically and systematically making decisions to reduce incomprehensible datasets down to a manageable size that can be viewed and understood easily. These reductions are made by performing data analytics, producing metrics, identifying patterns, and/or producing any other criteria of comparison that can be mathematically modeled.
With the use of High Performance Computing (HPC) and the ever-shrinking limitations to storage and processing, the size of data on which analytics can be performed has been growing exponentially. Datasets that originally took years to manually process can now be interpreted and visualized in days or weeks.
TradeAnalyzer enables the user to readily analyze data through multiple methods. Custom R-scripts and objective functions can be applied to the tradespace in order to create additional metrics or reduce the tradespace to a more manageable size for future assessments. A tradespace is defined as the set of system and program parameters, properties, and facets needed to meet specific performance standards.
Custom R-scripts are the primary technique of analytics in the tool suite. Mathematical models, or machine learning algorithms written in R, can be applied to the tradespace and executed to create plots, metrics, or reduce the tradespace for further analysis. Objective functions can be written to link the interaction between the data and goals and used to reduce the tradespace for further analysis.
The implementation of set-based design (SBD) and the use of HPC are two related pillars of Engineered Resilient Systems (ERS) that require large tradespace visualization. The coupling of SBD and HPC generates large amounts of complex data that surpass conventional desktop-based data processing methods. As opposed to point-based design where the design cycle begins with a single design, SBD begins with a sufficient number of design alternatives to cover the feasible tradespace. This allows for analytical tradeoffs between system attributes and competing requirements.
Hundreds of thousands of design-alternatives are often necessary to fully cover the tradespace. Generating these large datasets are often beyond the capacity of the standard desktop computers, thus, HPC is integral to the ERS workflow. The data output from the HPC machines is often too large to be ingested into typical desktop programs. In addition to technology constraints, the computer science expertise and time required to comprehend this data are typically outside the purview of most potential users.
TradeAnalyzer enables the user to readily explore large tradespaces using a variety of interactive visualizations, including histograms, two-dimensional (2D) and three-dimensional (3D) scatterplots, mutual information (MI) diagrams, parallel coordinate plots, and platform alternative scoring diagrams. These capabilities enable the user to explore multi-dimensional tradespaces. Additionally, visualizations can be rendered using custom R-scripts. The scripts can help to detect linear and non-linear relationships across attributes, find feasible clusters, and identify optimal platform solutions. Lastly, users can filter the data to optimal solutions and compare them across many attributes, giving the user increased computational power and visualization capability to support the acquisition decision-making process.
This work was done by Timothy W. Garton, Willie H. Brown, Eric R. Mixon, and Joshua Q. Church for the Army Engineer Research and Development Center. ERDC-0009
This Brief includes a Technical Support Package (TSP).
Engineered Resilient Systems
(reference ERDC-0009) is currently available for download from the TSP library.
Don't have an account?
More From SAE Media Group


Off-Highway Engineering
Artificial Intelligence Being Schooled for Mining Applications
Automotive Engineering
Pothole Detectives
Tech Briefs
Executive Forum: Machine Learning & AI
Sensor Technology
Using the IoT for Predictive Maintenance
Aerospace & Defense Tech Briefs
DigitalGlobe Taps Satellite Images, Data Analytics, AI, Machine Learning to Map Continent for PSMA Australia
Photonics & Imaging Technology
Vision-Based System Validates Driver Monitoring

Electronics & Sensors INSIDER
Wi-Fi Signals Can Measure Heart Rate — No Wearables Needed

Aerospace & Defense Tech Briefs
Digital Twins: How The Digital Replica Concept Is Used By Robotic Systems
Tech Briefs
Analytical Model Evaluates Battery Capability
Autonomous Vehicle Engineering
Data Drives Driverless Truck Launch

Aerospace & Defense Tech Briefs
Data Mining in Cyber Operations
Automotive Engineering
SkillReal Signs Tier 1 Supplier for NVIDIA-Powered AI Inspection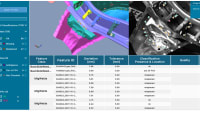
Aerospace & Defense Tech Briefs
AIA Predicts Flying Air Taxis, Supersonic Air Travel, and Space Industry for 2050
Automotive Engineering
Ford Releasing Comprehensive Dataset to Promote Autonomous R&D
Aerospace & Defense Tech Briefs
Educating UGVs
Tech Briefs
Robot Locates and Retrieves Buried Items


Photonics & Imaging Technology
Standard Digital Camera and AI to Monitor Soil Moisture


Tech Briefs
Boosting Operational Intelligence with AI
Motion Design
Vision Sensors in Factory Automation

Photonics & Imaging Technology
Novel Techniques Trick Object Detection Systems
Overview
The document ERDC/ITL TR-19-3 presents an overview of the Engineered Resilient Systems (ERS) program, specifically focusing on the TradeAnalyzer application developed by the U.S. Army Engineer Research and Development Center (ERDC). The ERS program aims to revolutionize the design and acquisition processes for future technologies within the Department of Defense (DoD). It encompasses three critical areas: design, execution, and analysis, all of which are essential for creating concepts, conducting extensive simulations, and visualizing large datasets.
TradeAnalyzer is a key tool within the ERS program, designed to handle the challenges posed by exponentially growing data sizes. It offers multiple visualization methods that allow users to examine, sort, and filter data attributes effectively. The application includes scripting capabilities, enabling users to perform custom analytics tailored to their specific needs. This flexibility is crucial for decision support, as it allows users to compare and contrast smaller sets of data once they have narrowed down their focus to designs that align with mission objectives.
The report is structured into six chapters. Chapter 1 provides an overview of the report's purpose and the situation at hand. Chapter 2 defines the concept of a tradespace and discusses industry-standard analysis tools. Chapter 3 delves into the structure of TradeAnalyzer and the mechanisms it employs to enhance the analysis of large datasets. Chapter 4 outlines the implementation structure of the system. Chapter 5 summarizes the report and its applications, while Chapter 6 discusses future work and research directions for additional TradeAnalyzer tool suites.
The analysis capabilities of the ERS program are continuously evolving, with a focus on developing processes and methods that can visualize and interpret large volumes of data in unprecedented ways. By integrating these advanced analytical methods, TradeAnalyzer serves as a vital tool for evaluating alternatives and supporting the decision-making needs of the DoD, ultimately contributing to a more effective acquisition process.
In summary, the document highlights the importance of innovative tools like TradeAnalyzer in transforming how the DoD approaches technology design and acquisition, emphasizing the need for robust data analysis and visualization in modern engineering practices.
Top Stories
INSIDERManufacturing & Prototyping
![]() How Airbus is Using w-DED to 3D Print Larger Titanium Airplane Parts
How Airbus is Using w-DED to 3D Print Larger Titanium Airplane Parts
NewsAutomotive
![]() Microvision Aquires Luminar, Plans Relationship Restoration, Multi-industry Push
Microvision Aquires Luminar, Plans Relationship Restoration, Multi-industry Push
INSIDERAerospace
![]() A Next Generation Helmet System for Navy Pilots
A Next Generation Helmet System for Navy Pilots
INSIDERDesign
![]() New Raytheon and Lockheed Martin Agreements Expand Missile Defense Production
New Raytheon and Lockheed Martin Agreements Expand Missile Defense Production
ArticlesAR/AI
![]() CES 2026: Bosch is Ready to Bring AI to Your (Likely ICE-powered) Vehicle
CES 2026: Bosch is Ready to Bring AI to Your (Likely ICE-powered) Vehicle
Road ReadyDesign
Webcasts
Semiconductors & ICs
![]() Advantages of Smart Power Distribution Unit Design for Automotive...
Advantages of Smart Power Distribution Unit Design for Automotive...
Unmanned Systems
![]() Quiet, Please: NVH Improvement Opportunities in the Early Design...
Quiet, Please: NVH Improvement Opportunities in the Early Design...
Electronics & Computers
![]() Cooling a New Generation of Aerospace and Defense Embedded...
Cooling a New Generation of Aerospace and Defense Embedded...
Power
![]() Battery Abuse Testing: Pushing to Failure
Battery Abuse Testing: Pushing to Failure
AR/AI
![]() A FREE Two-Day Event Dedicated to Connected Mobility
A FREE Two-Day Event Dedicated to Connected Mobility