


Subjective Mapping of Dust-Emission Sources by Using MODIS Imagery
Accurate dust-source characterizations are critical for effectively modeling dust storms and their associated hazards.
Dust storms (5 to 100 km across) often originate from multiple dust-emission sources (1 to 10 km across). Remote-sensing-based dust-source identification is a challenge. A previous study developed a subjective approach for mapping dust sources by using enhanced MODIS satellite imagery; therefore, this study conducted mapping exercises to assess the reproducibility of this technique amongst multiple analysts and in different regions.
Atmospheric soil and mineral dust can significantly influence a variety of global-scale processes, such as the radiation budget of the atmosphere, biogeochemical reactions that occur in the ocean, and global climate. On regional and local scales, lofted dust can negatively affect visibility, mobility, communication, and human health. As a result, understanding the processes that control spatial and temporal patterns of atmospheric dust occurrence has become a priority for the research, military, operational forecasting, and hazard mitigation communities.
Accurate dust-source characterizations are critical for effectively modeling dust storms and their associated hazards. Numerous remote-sensing studies have attempted to identify dust-emission-source locations. Historically, satellite-based approaches have struggled with dust-plume origin detection. This is because synoptic and mesoscale dust storms on the order of 5 to 100 km rarely originate from a single source but rather from the amalgamation of several point-source dust plumes. These smaller plumes stem from multiple point sources (i.e., plume heads 1 to 10 km across) that can evade coarser-resolution satellite detection.
Advances in satellite image resolution (1 km or better) have greatly enhanced the ability to detect plume heads remotely. A technique was even developed to manually map plume-head point sources in a geospatial information system (GIS) framework using Moderate Resolution Imaging Spectroradiometer (MODIS) imagery processed through a dust-enhancement algorithm. With this technique, a location is digitized and archived if the analyst observes an unobscured plume head in the imagery.
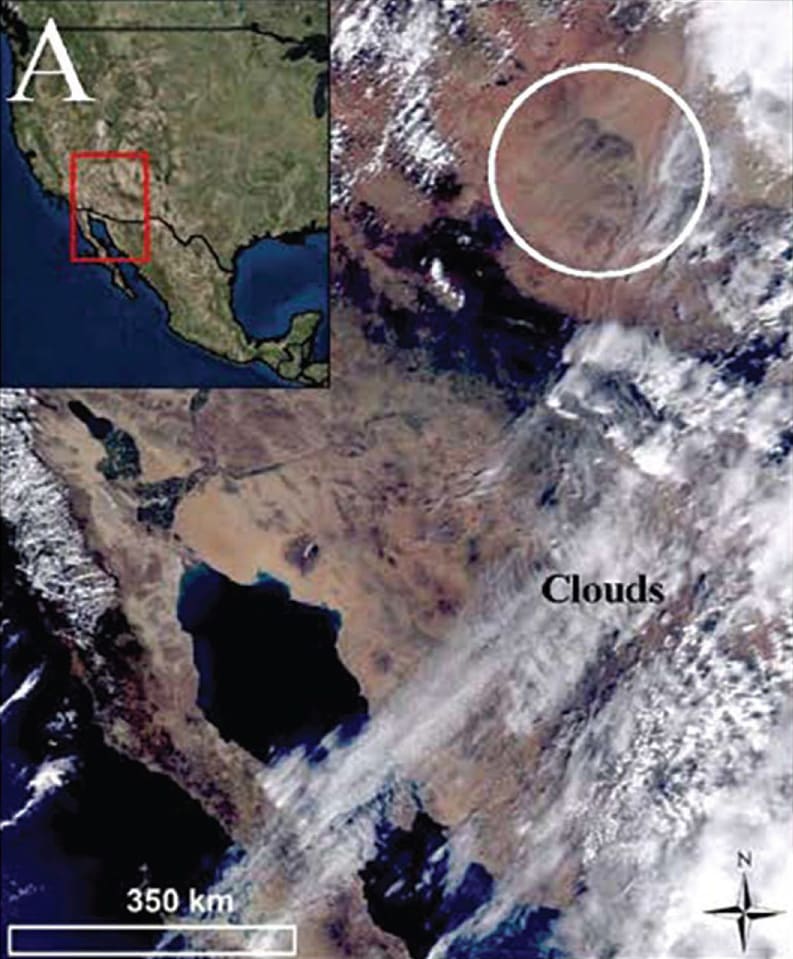
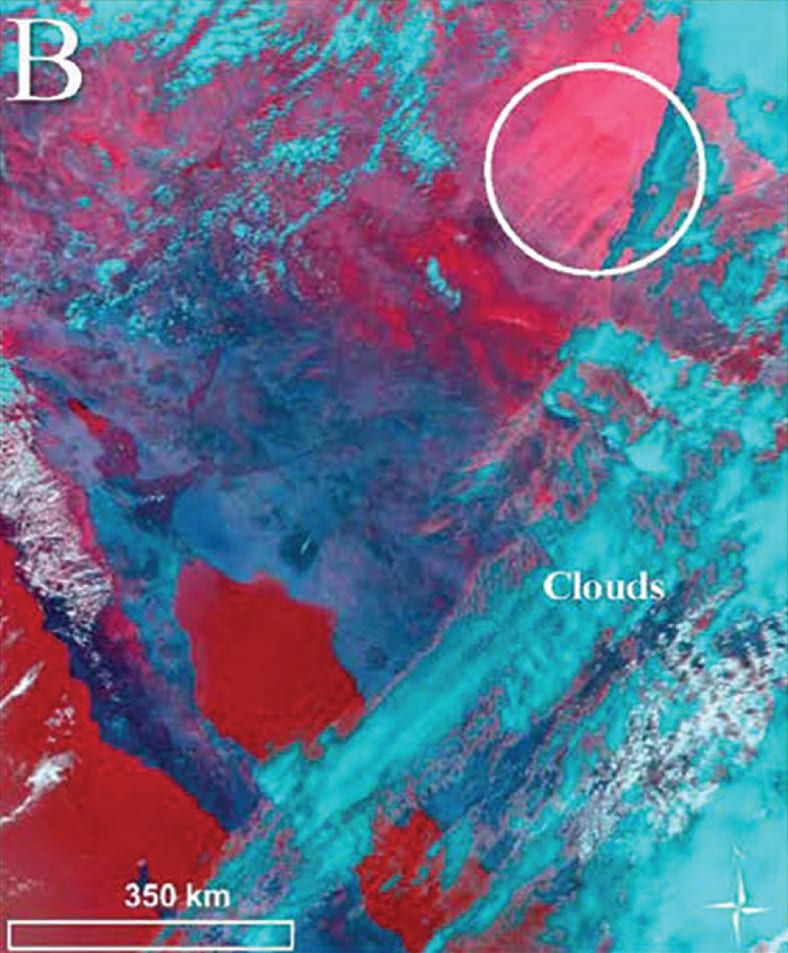
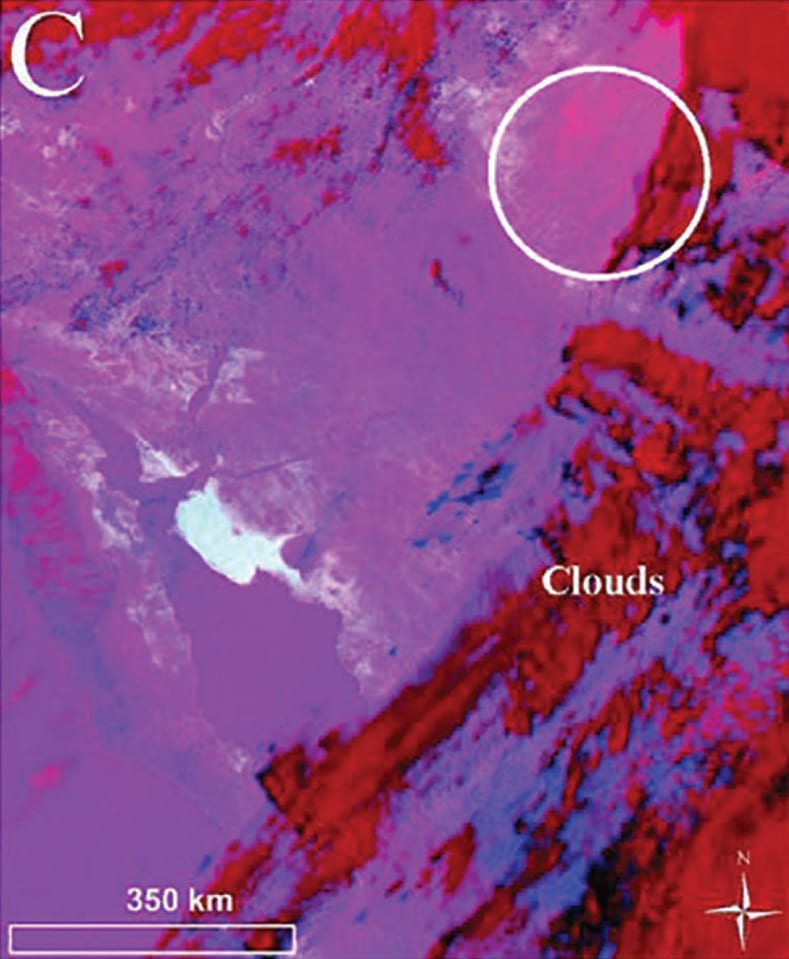
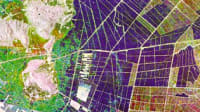
MODIS satellite imagery of the Southwest United States and Mexico. Panels A, B, and C depict the area outlined by the red box within the inset of Panel A. Panel A is a True Color image that depicts white clouds against a brown landscape; a bird's eye representation of Earth. Panel B is a MILLER image that depicts aqua-colored clouds against a dark blue/green landscape. Lofted dust appears pink while high-relief topography appears red. The white dashed box depicts a region that does not contain any lofted dust. Panel C is a EUMETSAT image that depicts red clouds against a purple landscape. Lofted dust appears hot pink. The white circle in each panel depicts a dust event. Note the pink dust that can be seen in Panels B and C is undetectable in Panel A.
Although analysts are able to map dust sources at the satellite-image grid scale, location analysis error is almost unavoidable. Airborne dust must be sufficiently elevated for overland dust enhancement algorithms to work; otherwise, thermal and reflectance contrast signals between the dust and the underlying surface may not be discernable. By the time the dust has reached a sufficient altitude, it is likely to have traveled downstream from its deflating source. As such, errors in digitized source location may be on the order of 1 to 10 km.
Even with this inherent uncertainty, this technique is a popular approach for dust-source identification and is often used as a proxy for dust-source observations. The methodology is also currently being used to incorporate dust sources into the Navy's Coupled Ocean-Atmosphere Mesosphere Prediction System, which to date remains the highest-resolution dust-source treatment in an operational military weather forecast model.
A group of analysts independently mapped plume-head point sources for two predetermined case-study dust events, one in the Southwest United States and one in Southwest Asia. For each case-study region, a single analyst downloaded Automated Surface Observing System (ASOS) weather data to identify dusty days reported in local weather station records. The same analyst then downloaded and processed true-color and dust-enhanced MODIS satellite imagery associated with each day of interest and selected a single time period for each regional case study based on a perceived potential for numerous mappable plume-head point sources. After reviewing mapping procedures and techniques, a group of additional analysts then individually mapped plume-head point sources in the images selected for each region by using ArcMap 10.3 and assigned a quality score (confidence level) to each mapped point. Results from each analyst were subsequently aggregated together and assessed for reproducibility.
This work was done by Samantha N. Sinclair and Sandra L. Jones for the Army Corps of Engineers. ERDC-0002
This Brief includes a Technical Support Package (TSP).
Subjective Mapping of Dust-Emission Sources by Using MODIS Imagery
(reference ERDC-0002) is currently available for download from the TSP library.
Don't have an account?
More From SAE Media Group
Aerospace & Defense Tech Briefs
Coastal Lidar and Radar Imaging System (CLARIS) Lidar Data Report
Aerospace & Defense Tech Briefs
SaraniaSat Wins $5M NASA InVEST Contract for Hyperspectral Thermal Imager
Aerospace & Defense Tech Briefs
Automated Atmospheric Correction of Nanosatellites Using Coincident Ocean Color Radiometer Data
Photonics & Imaging Technology
Eyes in the Sky: Using Optical Filters to Observe and Measure Earth From a Different Perspective

Photonics & Imaging Technology
Getting NASA Data to the Ground With Lasers
Tech Briefs
Data Recorders Aid Earth Dust Mission


Aerospace & Defense Tech Briefs
SAE International Extends Call for Abstracts, Seeks Submissions for AeroTech Conference
Tech Briefs
Portable Laser-Guided Robotic Metrology (PLGRM)


Aerospace & Defense Tech Briefs
Satellite Paves the Way for Improved Storm Tracking
Aerospace & Defense Tech Briefs
Industry Invited to Participate in AeroTech Aerospace and Defense Technical Program
Photonics & Imaging Technology
Hunting New Mining Deposits with Hyperspectral Imaging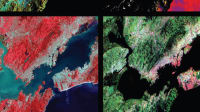
Tech Briefs
Getting NASA Data to the Ground with Lasers
Tech Briefs
Small But Mighty: Stratospheric Microballooons
Tech Briefs
Finding Earth’s Link to Space? An EZIE Task
Aerospace & Defense Tech Briefs
New Zealand and LeoLabs Establish the First Low-Earth Orbit Regulatory Platform
Aerospace & Defense Tech Briefs
GPS Radio Occultation and Ultraviolet Photometry-Colocated (GROUP-C) Early Orbit Testing Results


Tech Briefs
Prototype Fuel Gauge for Orbit
Overview
The document titled "Subjective Mapping of Dust-Emission Sources by Using MODIS Imagery: Reproducibility Assessment" (ERDC/CRREL TR-17-8) presents a comprehensive study on the identification and mapping of dust-emission sources in Southwest Asia and the Southwest United States using satellite imagery from the Moderate Resolution Imaging Spectroradiometer (MODIS).
The report begins with an introduction that outlines the significant impact of atmospheric soil and mineral dust on global processes, including climate change, visibility, and human health. Understanding the spatial and temporal patterns of dust occurrence is crucial for various sectors, including military operations and environmental management.
The methodology section details the process of acquiring and selecting satellite imagery, as well as the techniques used for mapping dust-plume-head point sources. Multiple analysts independently analyzed the imagery to identify reproducible dust sources, defined as locations where dust emission plumes could be constrained within a 10 km buffer. The results showed that 28% of mapped points in Southwest Asia were reproducible, while the Southwest United States achieved an 85% reproducibility rate. Expanding the buffer to 15 km improved these figures significantly.
The case study results reveal that points mapped by all analysts tended to align with specific landforms at a 1:750,000 scale, while at a finer scale of 1:100,000, the points were more dispersed across various landforms. This suggests that while the methodology is effective for certain applications, the tolerance for location uncertainty can influence the conclusions drawn from the data.
The report also includes a discussion on the implications of these findings for future research and operational forecasting. It emphasizes the need for improved methodologies to enhance the accuracy and reliability of dust source mapping, which is vital for understanding dust dynamics and mitigating its impacts.
In conclusion, the document serves as a valuable resource for researchers and practitioners interested in atmospheric dust, providing insights into the reproducibility of subjective mapping techniques and highlighting the importance of satellite imagery in environmental studies. The findings underscore the necessity for continued research in this area to better understand and manage the effects of dust on both local and global scales.
Top Stories
INSIDERDefense
![]() New Raytheon and Lockheed Martin Agreements Expand Missile Defense Production
New Raytheon and Lockheed Martin Agreements Expand Missile Defense Production
NewsAutomotive
![]() Ford Announces 48-Volt Architecture for Future Electric Truck
Ford Announces 48-Volt Architecture for Future Electric Truck
INSIDERManufacturing & Prototyping
![]() Active Strake System Cuts Cruise Drag, Boosts Flight Efficiency
Active Strake System Cuts Cruise Drag, Boosts Flight Efficiency
ArticlesTransportation
![]() Accelerating Down the Road to Autonomy
Accelerating Down the Road to Autonomy
INSIDERMaterials
![]() How Airbus is Using w-DED to 3D Print Larger Titanium Airplane Parts
How Airbus is Using w-DED to 3D Print Larger Titanium Airplane Parts
Road ReadyTransportation
Webcasts
Electronics & Computers
![]() Cooling a New Generation of Aerospace and Defense Embedded...
Cooling a New Generation of Aerospace and Defense Embedded...
Power
![]() Battery Abuse Testing: Pushing to Failure
Battery Abuse Testing: Pushing to Failure
Connectivity
![]() A FREE Two-Day Event Dedicated to Connected Mobility
A FREE Two-Day Event Dedicated to Connected Mobility
Automotive
![]() Quiet, Please: NVH Improvement Opportunities in the Early Design Cycle
Quiet, Please: NVH Improvement Opportunities in the Early Design Cycle
Transportation
![]() Advantages of Smart Power Distribution Unit Design for Automotive &...
Advantages of Smart Power Distribution Unit Design for Automotive &...
Aerospace
![]() Sesame Solar's Nanogrid Tech Promises Major Gains in Drone Endurance
Sesame Solar's Nanogrid Tech Promises Major Gains in Drone Endurance