


Optical-Fiber Infrasound Sensors
Features include directionality and relatively flat frequency response.
Optical-fiber infrasound sensors (OFISs) are being developed for detecting acoustic pressures in the frequency range from a few millihertz to a few hertz. As explained below, these sensors were conceived to overcome some of the limitations of prior infrasound sensors based on pipe filters connected to microbarographs.

The principal source of acoustic noise in the infrasound frequency range is wind turbulence. In a typical prior infrasound sensor based on a pipe filter connected to a microbarograph, the sound is summed acoustically from multiple locations connected to the microbarograph via the pipe filter in order to obtain an averaging or smoothing effect that suppresses the relative contribution of noise. Unfortunately, the acoustic sum is not a true average and is affected by the frequency response of the pipe filter, which response is not flat across the entire infrasound frequency band and can be determined only with extreme difficulty. In contrast, the response of an OFIS depends on the optical response of the fiber but is substantially independent of the acoustic frequency.

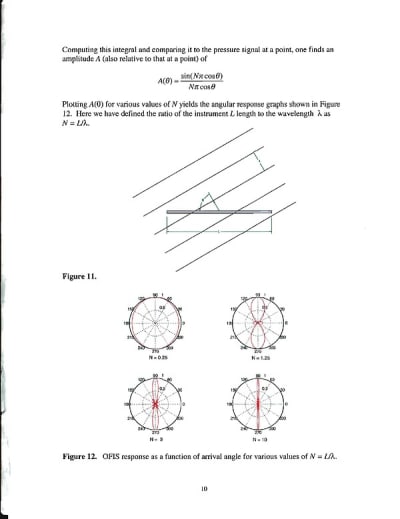
A(θ) = sin[Nπcos(ı)]/Nπcos(θ).
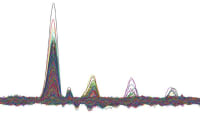
As illustrated by a few examples in Figure 2, this response peaks at broadside incidence (θ = 90°) and becomes more sharply peaked as N increases.
This work was done by Mark A. Zumberge and Jonathan Berger of the University of California for the Defense Threat Reduction Agency. For more information, download the Technical Support Package (free white paper) at www.defensetechbriefs.com/tsp under the Photonics category. DTRA-0001
This Brief includes a Technical Support Package (TSP).
Optical-Fiber Infrasound Sensors
(reference DTRA-0001) is currently available for download from the TSP library.
Don't have an account?
More From SAE Media Group
Aerospace & Defense Tech Briefs
Hybrid Micro-Electro-Mechanically Tunable Optical Filter
Photonics Tech Briefs
A High-Repetition-Rate Optical Communications Source
Photonics & Imaging Technology
Monitoring Additive Manufacturing with an Optical Microphone
Photonics & Imaging Technology INSIDER
NIST Creates Strobe Light to Test 5G Resonators
Aerospace & Defense Tech Briefs
Identifying and Isolating Signals Using Radio Frequency Photonics
Photonics & Imaging Technology INSIDER
New Products
Photonics & Imaging Technology
SPIE Photonics West 2022 Preview
Photonics Tech Briefs
WGM-Resonator/Tapered-Waveguide White-Light Sensor Optics
Tech Briefs
Sensitive Optical Receivers for Space
Photonics & Imaging Technology
Ultra-Broadband Photonic Chip Boosts Optical Signals
Photonics & Imaging Technology
Optical Signal Amplifying Technique
Photonics Tech Briefs
Optoelectronic System Measures Distances to Multiple Targets
Photonics & Imaging Technology
Vision System Assures Glass Act at California Shop
Photonics Tech Briefs
Digital Averaging Phasemeter for Heterodyne Interferometry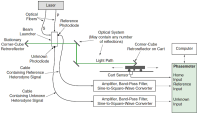
Photonics Tech Briefs
Common-Path Heterodyne Interferometers
Photonics Tech Briefs
Two-Fiber-Optic Method of Laser Doppler Velocimetry
Photonics Tech Briefs
Dual-Target, Single-Laser Metrological System
Photonics Tech Briefs
Discrete Wavelength-Locked External Cavity Laser
Photonics & Imaging Technology INSIDER
Infrared Imaging by Ultrathin Nanocrystal Layers
Tech Briefs
Optical Signal Amplifying Technique
Photonics Tech Briefs
Compact, Low-Power, Low-Voltage Laser Ignition System
Photonics & Imaging Technology INSIDER
7 Finalists for SPIE Startup Challenge at Photonics West 2025
Photonics & Imaging Technology INSIDER
New Product Launches and Technologies to See at Photonics West 2025
Sensor Technology
New Depth Sensors Could be Sensitive Enough for Self-Driving Cars
Photonics & Imaging Technology
Unique Amplifier Could Change Optical Communication
Sensor Technology
Smart Windows Self-Illuminate on Rainy Days
Photonics & Imaging Technology
SPIE Photonics West 2023 Preview
Photonics & Imaging Technology
Signal-to-Noise Ratio (SNR) in Hyperspectral Imagers
Photonics & Imaging Technology INSIDER
Stanford Researchers Develop Flexible Color-Changing Material
Overview
The document discusses the relationship between integral computations and pressure signals, particularly focusing on the amplitude response of a system as a function of the arrival angle. It introduces a mathematical framework where the amplitude ( A(\theta) ) is expressed in terms of the cosine of the angle ( \theta ) and a parameter ( N ), which is defined as the ratio of the instrument length ( L ) to the wavelength ( \lambda ) (i.e., ( N = \frac{L}{\lambda} )).
The analysis begins with the computation of an integral that relates to the pressure signal at a specific point. By comparing this integral to the pressure signal, the document derives the expression for amplitude ( A(\theta) ), which is given by:
[ A(\theta) = N \cdot n \cdot \cos(\theta) ]
This relationship indicates that the amplitude is influenced by both the parameter ( N ) and the cosine of the angle of arrival, suggesting that the system's response varies with the angle at which the signal arrives.
The document includes graphical representations (referred to as Figures 11 and 12) that illustrate the angular response of the system for various values of ( N ). These graphs provide visual insights into how the amplitude changes with different angles, highlighting the dependence of the system's response on the ratio of instrument length to wavelength.
The findings emphasize the importance of understanding the angular response in applications where pressure signals are critical, such as in acoustics or fluid dynamics. By plotting ( A(\theta) ) for different values of ( N ), researchers can better predict how the system will behave under varying conditions, which is essential for designing instruments and interpreting data accurately.
Overall, the document serves as a concise exploration of the mathematical and graphical analysis of amplitude response in relation to pressure signals, offering valuable insights for researchers and practitioners in fields that rely on such measurements. The interplay between the parameters involved and the resulting angular response is crucial for advancing knowledge in this area.
Top Stories
INSIDERManufacturing & Prototyping
![]() How Airbus is Using w-DED to 3D Print Larger Titanium Airplane Parts
How Airbus is Using w-DED to 3D Print Larger Titanium Airplane Parts
INSIDERManned Systems
![]() FAA to Replace Aging Network of Ground-Based Radars
FAA to Replace Aging Network of Ground-Based Radars
NewsTransportation
![]() CES 2026: Bosch is Ready to Bring AI to Your (Likely ICE-powered) Vehicle
CES 2026: Bosch is Ready to Bring AI to Your (Likely ICE-powered) Vehicle
NewsSoftware
![]() Accelerating Down the Road to Autonomy
Accelerating Down the Road to Autonomy
EditorialDesign
![]() DarkSky One Wants to Make the World a Darker Place
DarkSky One Wants to Make the World a Darker Place
INSIDERMaterials
![]() Can This Self-Healing Composite Make Airplane and Spacecraft Components Last...
Can This Self-Healing Composite Make Airplane and Spacecraft Components Last...
Webcasts
Defense
![]() How Sift's Unified Observability Platform Accelerates Drone Innovation
How Sift's Unified Observability Platform Accelerates Drone Innovation
Automotive
![]() E/E Architecture Redefined: Building Smarter, Safer, and Scalable...
E/E Architecture Redefined: Building Smarter, Safer, and Scalable...
Power
![]() Hydrogen Engines Are Heating Up for Heavy Duty
Hydrogen Engines Are Heating Up for Heavy Duty
Electronics & Computers
![]() Advantages of Smart Power Distribution Unit Design for Automotive...
Advantages of Smart Power Distribution Unit Design for Automotive...
Unmanned Systems
![]() Quiet, Please: NVH Improvement Opportunities in the Early Design...
Quiet, Please: NVH Improvement Opportunities in the Early Design...